Data analysis pipeline
scRNA-seq data pre-processing
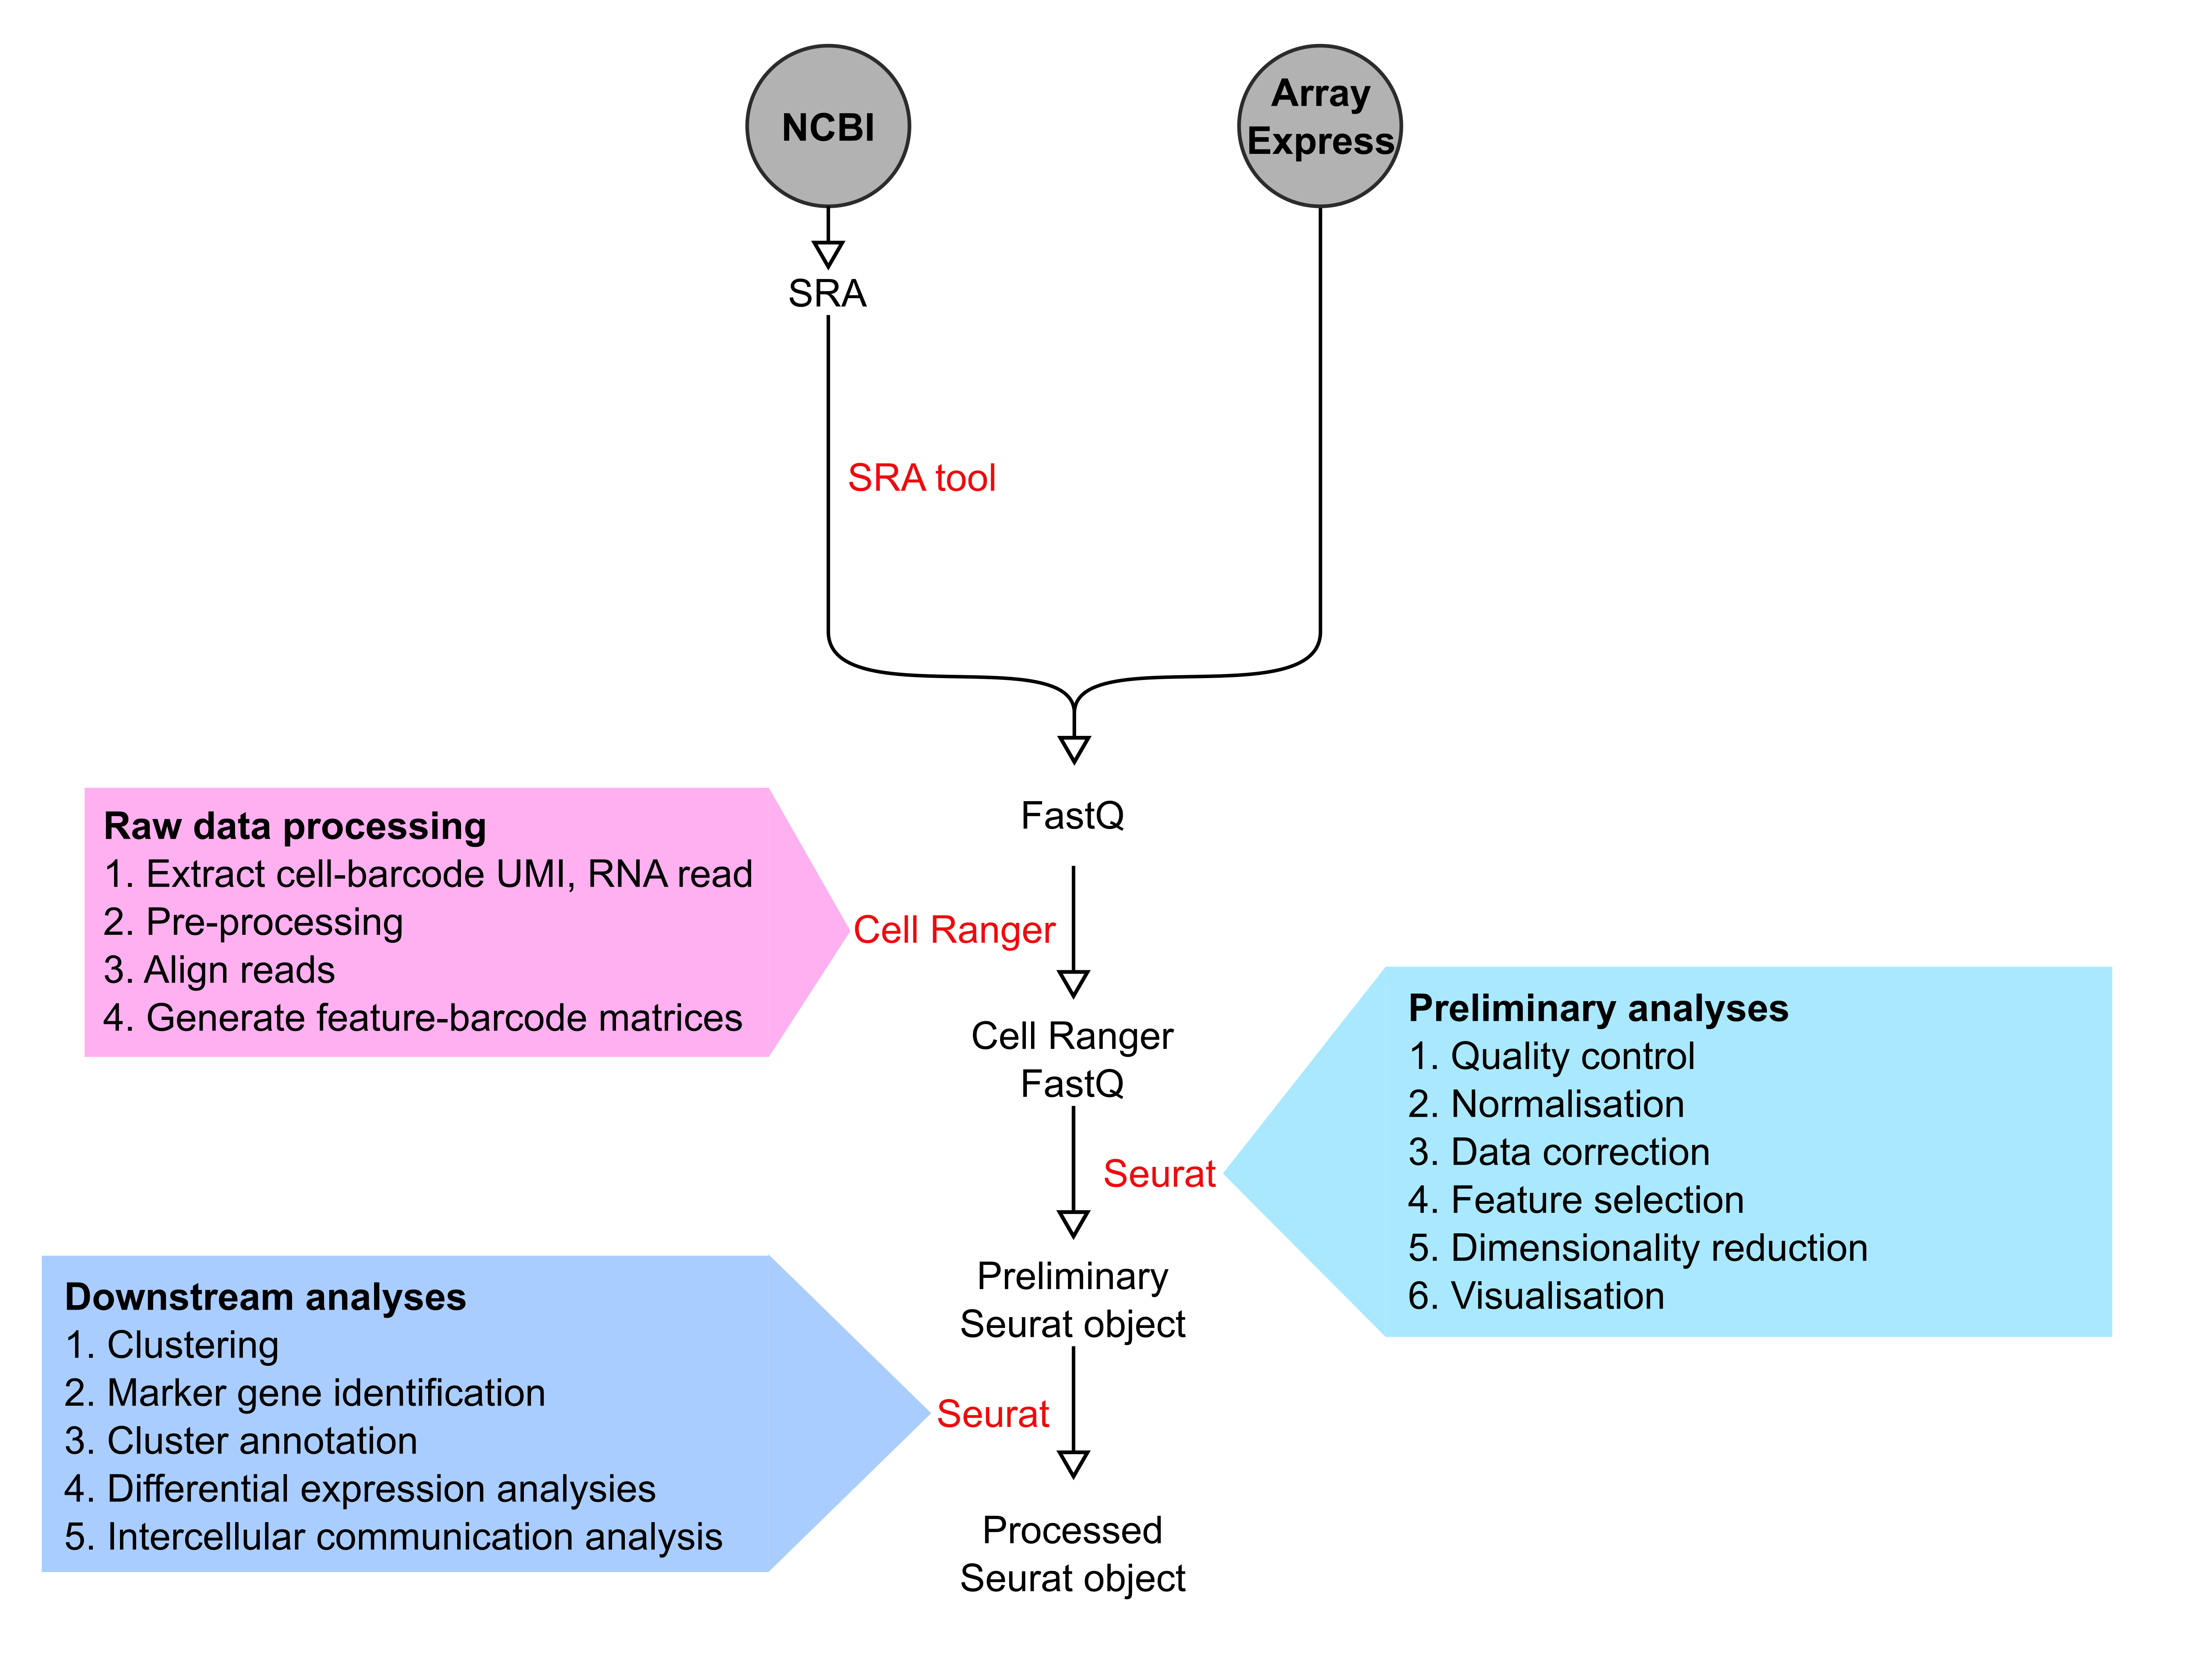
Raw data corresponding to selected scRNA-seq datasets were downloaded from NCBI and ArrayExpress as SRA or FastQ files, respectively. SRA files were first converted to FastQ file format using SRA toolkit v2.10.9. Cell Ranger versions 3.1.0, 4.0.0 and 5.0.0 (10X Genomics) were used for subsequent processing including extraction of cell-barcodes, UMI and RNA reads. RNA sequencing reads were then aligned to the mm10 or GRCh38 genome assemblies for mouse and human datasets, respectively, before quantification of transcript levels in each cell to create feature-barcode matrices.
Preliminary analysis
The preliminary analyses of processed scRNA-seq data were carried out in R version 3.6 and 4.0.1 using the Seurat suite versions 3.2.0 and 4.0.1. First, initial quality control was applied to each dataset. Cells with very few or aberrantly high genes detected, and genes with transcripts in very few cells were filtered out. In addition, cells high proportion of raw UMIs mapping to mitochondrial genes were removed. For specific details please see Table S1 in Dona et al 2021.
Second, UMIs were normalized to counts-per-ten-thousand, log-transformed, and a set of highly variable genes was identified by gating for mean expression level and dispersion level in a per-data-set manner. The log-normalized data were then scaled, with variation due to the total number of UMIs regressed out using a linear model. Furthermore, two thousand highly variable features (genes) per dataset were identified by using vst method in FindVariableFeature function.
Finally, for each dataset, Principal Component Analysis (PCA) was run on the scaled data using the set of previously defined highly variable genes. Elbow plots implemented by the Seurat R package was used to decide the number of principal components (PCs) to use for clustering.
Downstream analysis
The downstream analysis for scRNA-seq datasets were performed in R version 3.6 and 4.0.1. Figures were primarily generated using Seurat and ggplot2 R packages. For each dataset, the optimal number of PCs and resolution parameters were used to perform non-linear dimension reduction such as t-SNE.
For each dataset, cell population-specific marker genes were identified using FindAllMarkers function in the Seurat R package. The identified cell clusters were then annotated based on known marker genes (see Cell type definitions).
In order to identify differentially expressed (DE) genes in each dataset, we first filtered genes expressed in at least 10% of cells and in at least one of the groups being compared. This was performed for each cell type separately. The differential expression analysis method MAST was used to identified DE genes between groups considering cellular detection rate as a covariate.
Intercellular communication between cardiac cell populations were determined by considering expression levels of ligand and cognate receptor pairs from a human dataset (see Dona et al., 2021 for details). To obtain mouse orthologs of human ligand-receptor pairs biomaRt R package and Ensembl database version 101 was used.
A ligand/receptor gene with non-zero expression in more than 20% of cells of a particular cell population was considered an “expressed” ligand/receptor. To construct the putative cell-cell signalling network for a given ligand-receptor pair, the average expression for each cell population was calculated for each condition. Cell populations with less than 5 cells were discarded from this analysis. In the ligand-receptor signalling network visualization, we linked expressed ligand with its corresponding receptor between and within cell populations. The signalling direction from ligand to receptor is indicated by an arrow with the thickness and colour intensity proportional to the strength of the interactions between cell populations. The strength of a ligand-receptor interaction was calculated based on the expression values of both ligand and receptor genes in corresponding cell populations. The line colour reflects the cell population producing the ligand transcript.